Alerts
The alerts feature sends a notification when monitored devices satisfy a given condition, or when the results of a saved device or issue search change. The following table lists the available alert types.
| Alert type | Trigger | Polling frequency |
|---|---|---|
| Fleet threshold alert | Fleet-wide aggregation of a timeseries metric meets a condition | Hourly |
| Device threshold alert | Metric value in a received report meets a condition | Not applicable — evaluated as soon as the metric report arrives |
| Device offline alert | Device stops checking in with nRF Cloud | Every five minutes |
| Reboot alert | Device or fleet reboot count meets a condition | Not applicable — evaluated when reboot data arrives |
| Saved search alert | Devices or issues enter or leave a saved search, or the number of matches crosses a threshold | Hourly |
Fleet threshold alerts
Fleet threshold alerts operate on aggregate metric conditions. For example, you
can configure a fleet threshold alert that triggers when the production cohort
surpasses a mean count of five connection failures in a time window of one hour.
Only metrics marked as timeseries can be used in the condition for a fleet threshold alert.
nRF Cloud evaluates fleet threshold alerts every hour. You receive a notification if the aggregate meets the condition for data points in the preceding hour.
Device threshold alerts
Device threshold alerts trigger when any device reports a certain value or range of values for a metric.
Any metric marked as timeseries can be used in the condition for a device threshold alert.
Whenever nRF Cloud receives a heartbeat event with metrics from a device, it evaluates the applicable device threshold alerts and creates incidents when the condition is met. Depending on the alert configuration, nRF Cloud can send notifications immediately as an incident starts, or as a scheduled summary of new incidents.
Incident creation and resolution
The start and end delays in the alert configuration control when nRF Cloud creates and resolves an incident. Use these values to reduce incident noise.
-
The incident start delay is the time that must pass before an incident is declared after the metric condition is met.
For example, if a value sometimes briefly goes above the threshold but returns to normal within an hour, set the start delay to 1 hour 30 minutes to avoid creating an incident for a brief spike.
nRF Cloud creates an incident only if another matching value arrives after the start delay has passed, or if no data arrives for at least the start delay period.
A new incident appears as ALERTING in the incident list.
-
The incident end delay is the time that must pass before an incident is resolved after the metric condition is no longer met.
For example, if an alert frequently resolves and then starts firing again shortly after, set an end delay to keep the incident in the ALERTING state unless a new value arrives after the end delay has passed.
Unlike the start delay, if a device reports no new data, the incident stays in the ALERTING state until a new value arrives.
A resolved incident appears as RESOLVED in the incident list.
For alerts created before the delay feature became available, the start delay shows No delay and the end delay shows 1 day. This matches the previous behavior, where every alert had a maximum of one incident per 24-hour period. Set these values to something reasonable for each alert.
Incident start and end delays illustrated
Basic example
The following example shows an alert with a start delay of 15 minutes and an
end delay of 30 minutes. The metric threshold is set to
battery_discharge > 50.
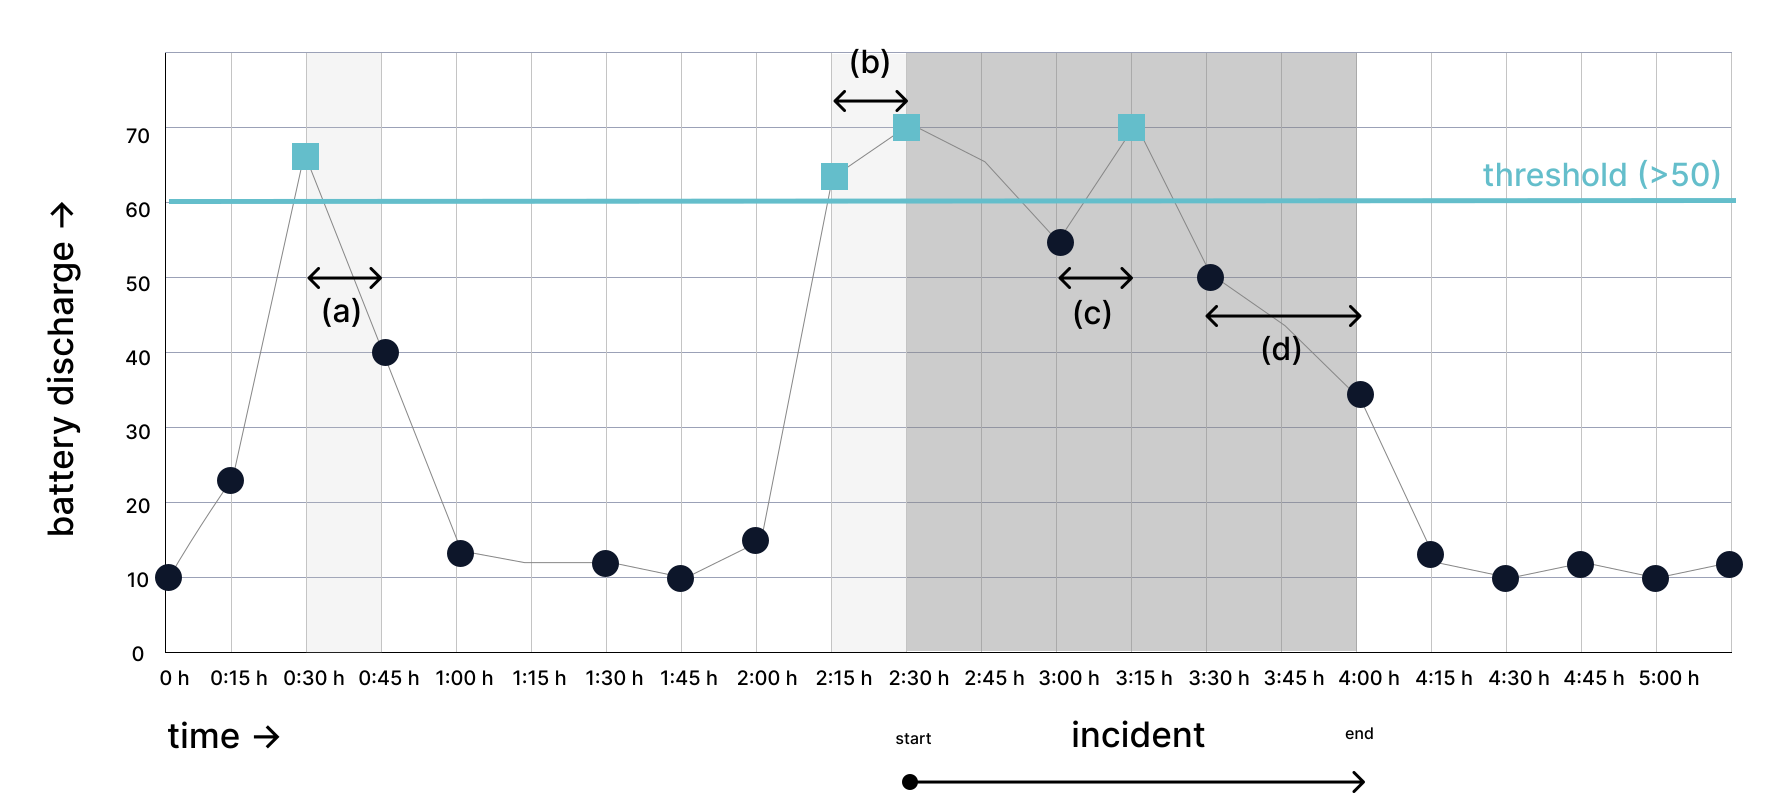
Incident creation and resolution for a metric threshold with a 15-minute start delay and a 30-minute end delay.
-
At (a) 0:30 h, the device captures a value above the threshold, but no incident is created yet. The device captures a new value below the threshold at 0:45 h, so this momentary spike is ignored.
-
At (b) 2:15 h, the device captures another value above the threshold. A further above-threshold value arrives at 2:30 h, which is when the incident is created, because the start delay of 15 minutes has passed.
If you enable Notify: when an incident starts, nRF Cloud notifies the configured targets when it receives this value.
-
At (c) 3:00 h, the device captures a value below the threshold. The incident is not resolved yet, because the end delay of 30 minutes has not passed, and the device captures a new value above the threshold shortly after, keeping the incident in the ALERTING state.
-
At (d) 3:30 h, the device captures another value below the threshold. The incident is resolved when an additional below-threshold value arrives at 4:00 h, because the end delay of 30 minutes has passed.
If you enable Notify: when an incident is resolved, nRF Cloud notifies the configured targets when it receives this value.
When no data is received
The next example shows what happens when nRF Cloud receives no data.
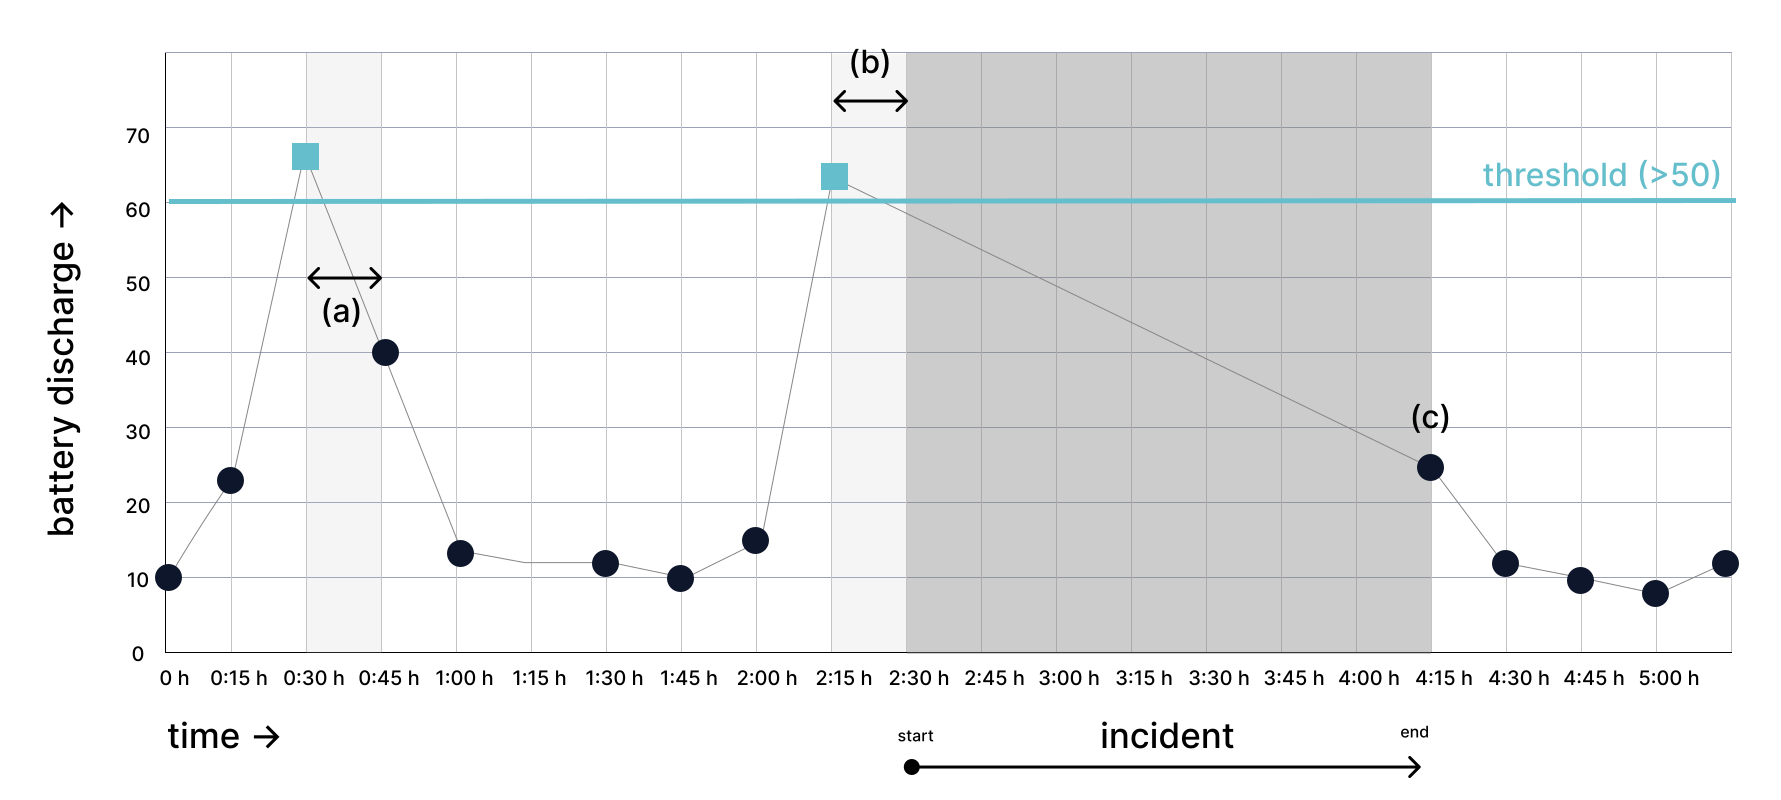
Incident creation and resolution when a device stops reporting data altogether.
-
This example resembles the previous one until the event at (b) 2:15 h, after which the device stops sending data for a period, for example because it was powered off.
-
nRF Cloud creates an incident automatically once the start delay has passed since the receipt of the last value, that is, 15 minutes for this alert. For the difference between capture time and receive time, see Capture vs. receive time.
-
nRF Cloud does not resolve the incident automatically after the end delay of 30 minutes has passed, because no new data has arrived to confirm that the device is behaving as expected.
-
When the device is seen again at (c) 4:15 h with a value below the threshold, nRF Cloud resolves the incident, because more than 30 minutes have passed since the (b) 2:15 h value.
Capture vs. receive time
Devices may report data in real time or near real time, in batches, or with significant latency.
nRF Cloud handles this diverse set of device heartbeat intervals by calculating incident start and end delays from the capture timestamp rather than the received timestamp, except in the following cases:
-
If no data arrives after a value that crosses the threshold, as in When no data is received, the start delay is evaluated from the last received timestamp, and an incident is created automatically once that delay has passed.
-
If a device sends timestamps in the future, nRF Cloud treats the values as if they were captured at the time of receipt.
-
If no capture timestamp is set, nRF Cloud uses the received timestamp instead.
-
If data arrives out of order, nRF Cloud ignores any value whose capture timestamp precedes the last received timestamp.
A start or end delay shorter than the heartbeat or batch interval of the device behaves like no delay at all. To prevent noise, use a delay that is at minimum slightly longer than the heartbeat interval.
By default, the MCU SDK timestamps events at upload time. On Linux and AOSP, the SDK always timestamps events on the device using the real-time clock (RTC). This works well for frequently connected devices, but for devices that batch-upload many heartbeats at once, every event in a batch receives the same timestamp. Set an event timestamp using the MCU SDK to avoid this.
The default MCU heartbeat interval is 3600 seconds (one hour). For more information, see MCU metrics.
Creating a device threshold alert
This example creates an alert that triggers when battery_perc (battery
percentage) drops below 5% on devices whose serial numbers start with MFLT.
- In the navigation menu, select Alerts, and then select Create Alert.
- Provide a Title, and optionally a Description to record why the alert exists.
- For Type, select Device Threshold.
- Set a Metric Condition from the list of heartbeat metrics, or enter the
metric key to find it. For this example, select
battery_perc, the<operator, and the value 5. - Under Scope, select (+) and condition and set Device Serial to
start with
MFLT. - Under Notifications, choose which targets receive the alert. To manage the available targets, select Manage targets to go to the settings page.
- Optionally, set an Incident Start Delay and Incident End Delay. For more information, see Incident start and end delays illustrated.
- Specify when to receive notifications for this alert:
- To be notified as soon as an incident is created, select when a new incident starts. Incident creation depends on the start delay.
- To be notified as soon as the incident is resolved, select when an incident is resolved. Incident resolution depends on the end delay.
- To receive a summary of new and active incidents, select a scheduled summary of incidents and set a schedule. The time zone is prefilled from your browser or custom time zone, and you can change it. Each alert supports a minimum of one and a maximum of four summary schedules.
- Select OK to create the alert.
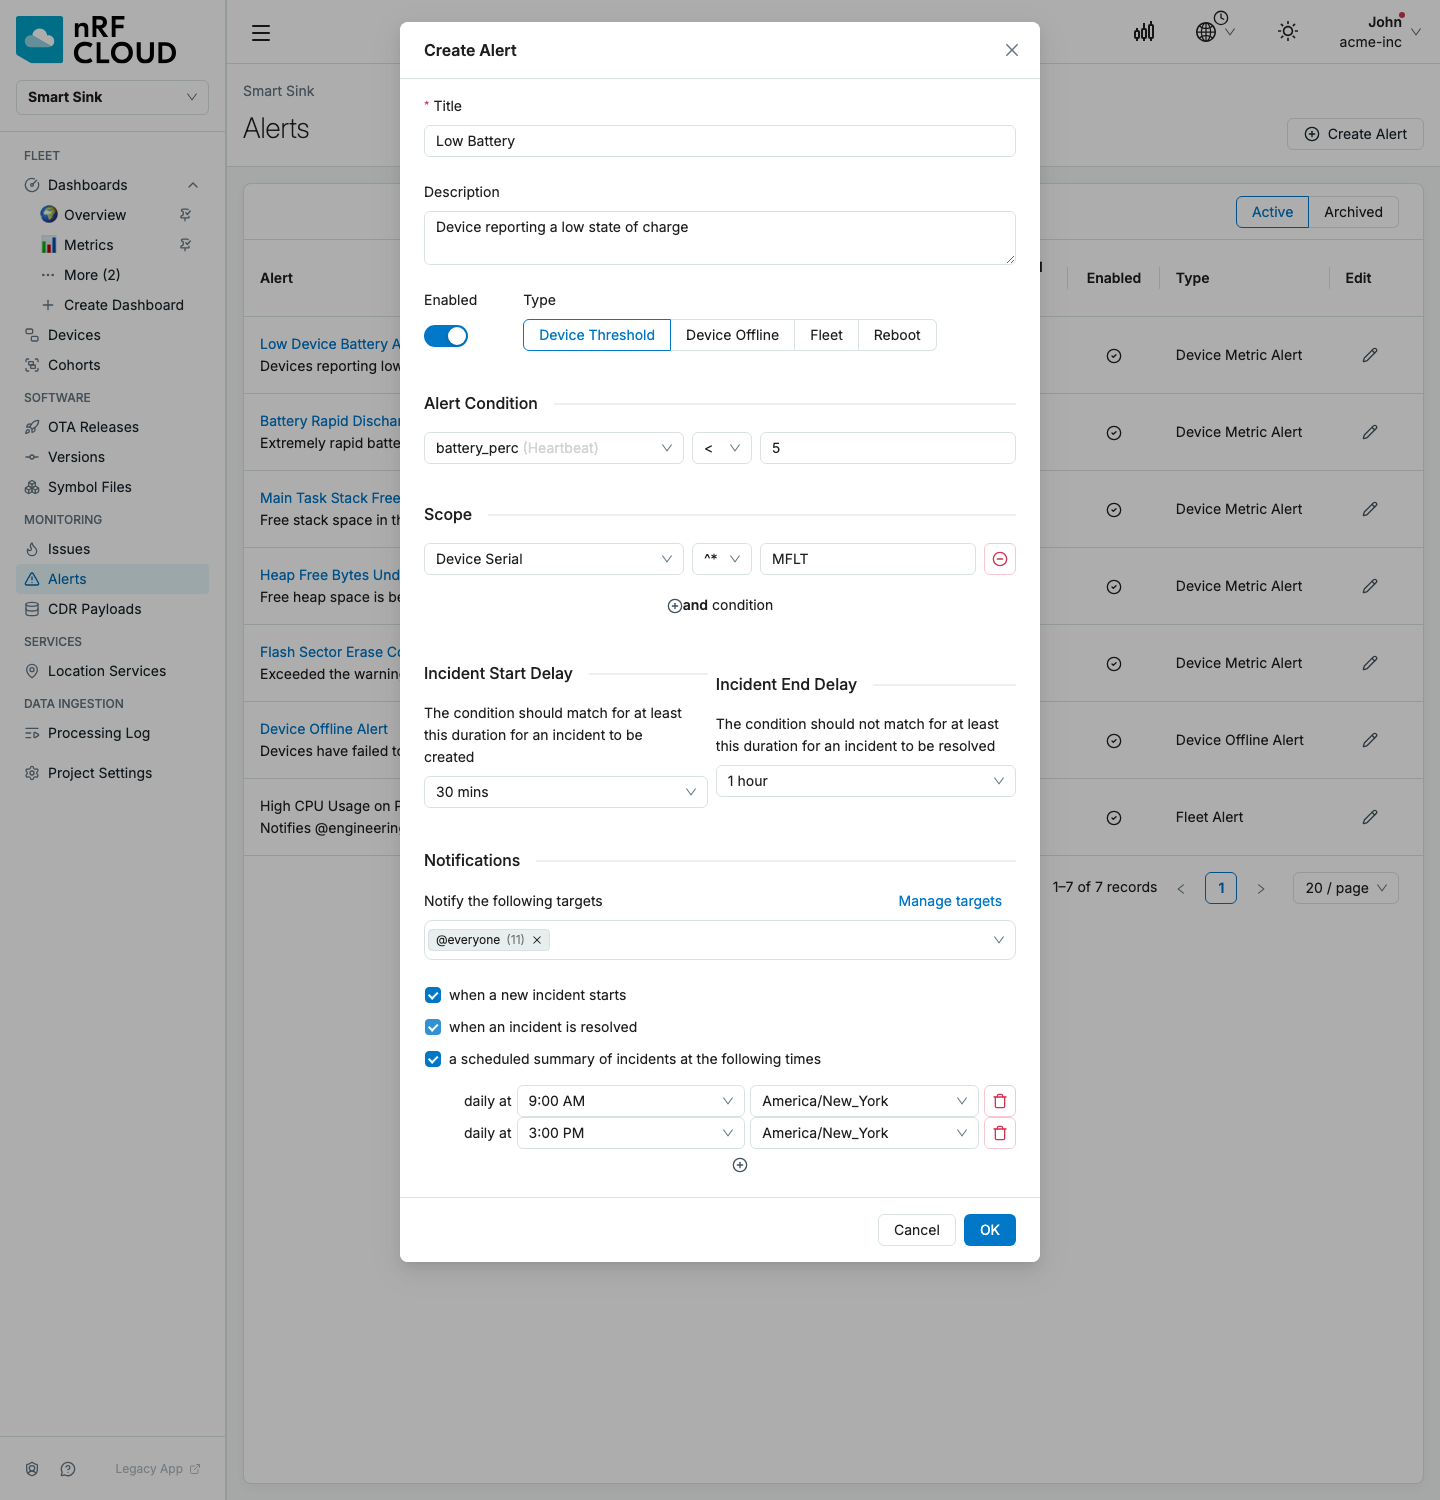
A device threshold alert that triggers when battery_perc drops below 5% on
devices with a serial number starting with MFLT, using a 30-minute start
delay and a one-hour end delay.
Device offline alerts
Device offline alerts trigger when any device in a set of monitored devices stops checking in, that is, when the device stops uploading data from the device SDK to nRF Cloud.
Incident creation and resolution
nRF Cloud evaluates this alert type every five minutes: for each device in the set of monitored devices, it checks whether the device has checked in within the allowed time window.
The start and end delays in the alert configuration control when nRF Cloud creates and resolves an incident. Use these values to reduce incident noise.
-
The incident start delay is the time that must pass before an incident is declared after a device has stopped checking in.
For example, if devices are configured to check in every hour, set the start delay to at least one hour. Otherwise, nRF Cloud continuously creates and resolves incidents. In other words, the expected check-in interval must be shorter than the start delay.
A new incident appears as ALERTING in the incident list.
-
The incident end delay is the period during which a device must keep checking in before an incident is resolved.
For example, if an alert frequently resolves and then starts firing again shortly after, set an end delay. This keeps the incident in the ALERTING state and resolves it only if the device has been checking in for at least the end delay period.
A resolved incident appears as RESOLVED in the incident list.
Because nRF Cloud evaluates device offline alerts every five minutes, the
maximum latency in detecting a device going offline is
(incident start delay + 5 minutes).
Incident start and end delays illustrated
Basic example
The following example shows an alert with a start delay of one hour and no end delay.
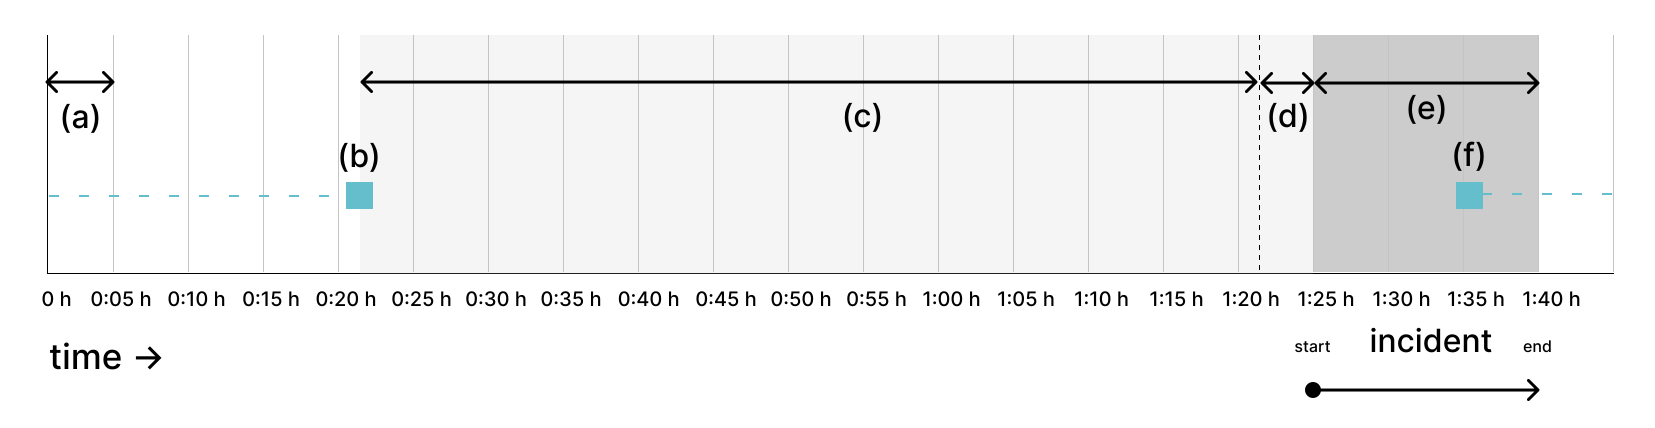
A device offline alert with a one-hour start delay and no end delay, showing the rounding introduced by the five-minute evaluation interval.
- nRF Cloud evaluates device offline alerts every five minutes (a). The gray vertical lines represent the evaluation intervals.
- At (b) 0:22 h, the device checks in with nRF Cloud, but falls silent after this.
- At 1:22 h, the start delay of one hour (c) has passed. However, the next evaluation happens at 1:25 h, which is when nRF Cloud creates the incident.
- Because of the five-minute evaluation interval, the incident start carries an error of +3 minutes (d), making the effective start delay 1 hour and 3 minutes.
- At (f) 1:36 h, the device checks in again.
- At 1:40 h, the next evaluation runs and nRF Cloud resolves the incident after 15 minutes (e), because the device has checked in again.
- Even with no end delay configured, resolution still lagged by 4 minutes because of the five-minute evaluation frequency.
End delay example
The following example shows an alert with a start delay of 1 hour 30 minutes and an end delay of two hours. For simplicity, this example omits the time grid.
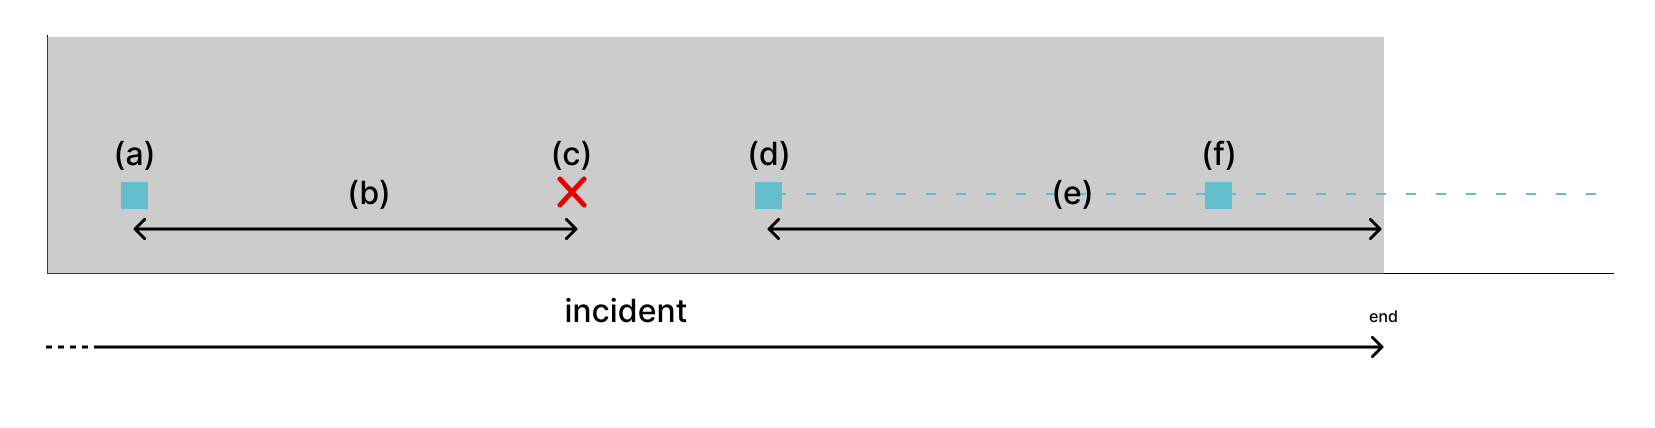
A device offline alert with a 1 hour 30 minute start delay and a two-hour end delay, showing an incident that resolves only after sustained check-ins.
- An incident already exists at the start of the diagram.
- At (a), the device checks in with nRF Cloud. The incident is not resolved yet, because the end delay of two hours has not passed.
- The start delay (b) has lapsed again, but no check-in has happened in the meantime (c): the incident stays in the ALERTING state.
- At (d), the device checks in again. Before the start delay lapses again, the device checks in again at (f).
- nRF Cloud resolves the incident after the end delay (e): the end delay of two hours has now passed, and the device kept checking in.
Creating a device offline alert
This example creates a device offline alert for all devices in the Production
cohort. The devices are expected to check in every hour. The example uses a
start delay of two hours and an end delay of four hours, because devices can go
offline briefly due to spurious periods of network unavailability.
- In the navigation menu, select Alerts, and then select Create Alert.
- Provide a Title, and optionally a Description to record why the alert exists.
- For Type, select Device Offline.
- Select the Select Devices button, add the Current Cohort filter, set
it to
Production, and select Apply. - Set an Incident Start Delay and Incident End Delay. For more information, see Incident start and end delays illustrated.
- Specify when to receive notifications for this alert:
- To be notified as soon as an incident is created, select when a new incident starts. Incident creation depends on the start delay.
- To be notified as soon as the incident is resolved, select when an incident is resolved. Incident resolution depends on the end delay.
- To receive a summary of new and active incidents, select a scheduled summary of incidents and set a schedule. The time zone is prefilled from your browser or custom time zone, and you can change it. Each alert supports a minimum of one and a maximum of four summary schedules.
- Select OK to create the alert.
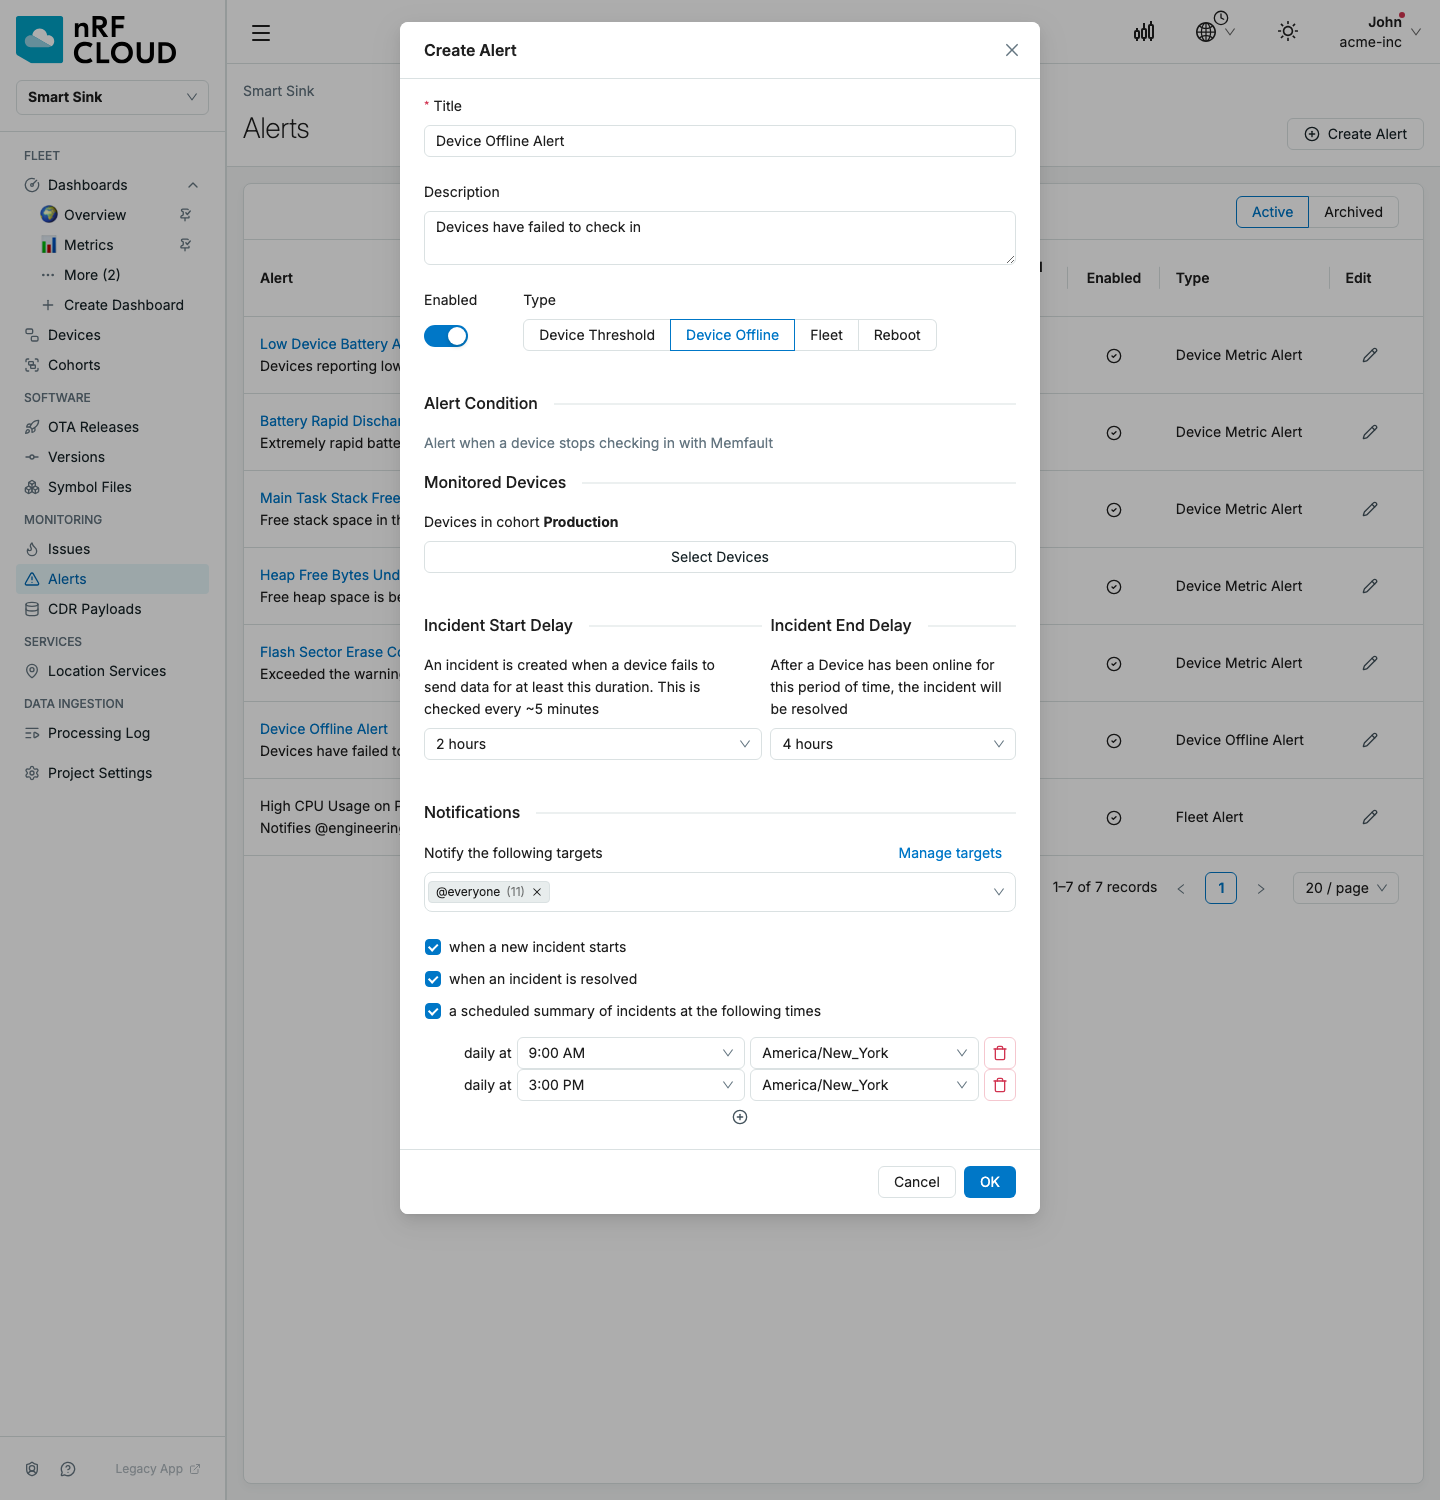
A device offline alert scoped to the Production cohort with a two-hour
start delay and a four-hour end delay.
Reboot alerts
Reboot alerts notify you when devices or fleets exceed reboot thresholds. Reboot alerts are available on MCU, Linux, and Android.
Reboot alert scope and filters
Reboot alerts support three scope types:
- Per Device: triggers when a single device reboots more than a set number of times within a configurable time window.
- Fleet Percentage: triggers when a configurable percentage of the fleet exceeds a reboot count threshold.
- Change over Period: triggers on week-over-week or month-over-month changes in reboot count, which is useful for catching regressions introduced by a new firmware release.
A Reboot Reason Filter narrows the alert to the reboots that matter most:
- All Reboots: alerts on any reboot.
- All Unexpected: alerts only on reboots that were not clean shutdowns, for example watchdog resets or hard faults.
- Custom: alerts on a selected set of reboot reason codes.
You can route notifications to email, Slack, or webhooks using the same notification targets as any other alert type.
Creating a reboot alert
- In the navigation menu, select Alerts, and then select Create Alert.
- Provide a Title, and optionally a Description.
- For Type, select Reboot.
- Under Alert Condition, choose a Scope Type:
- For Per Device, set the reboot count threshold and the time window.
- For Fleet Percentage, set the percentage of devices that must exceed the threshold and the time window.
- For Change over Period, choose the comparison period and the percentage change that triggers the alert.
- Optionally, set a Reboot Reason Filter to restrict which reboot types count toward the threshold.
- Optionally, under Device Scope, select the Select Devices button to scope the alert to a specific cohort or set of devices.
- Under Notifications, select the notification targets and configure when to receive notifications.
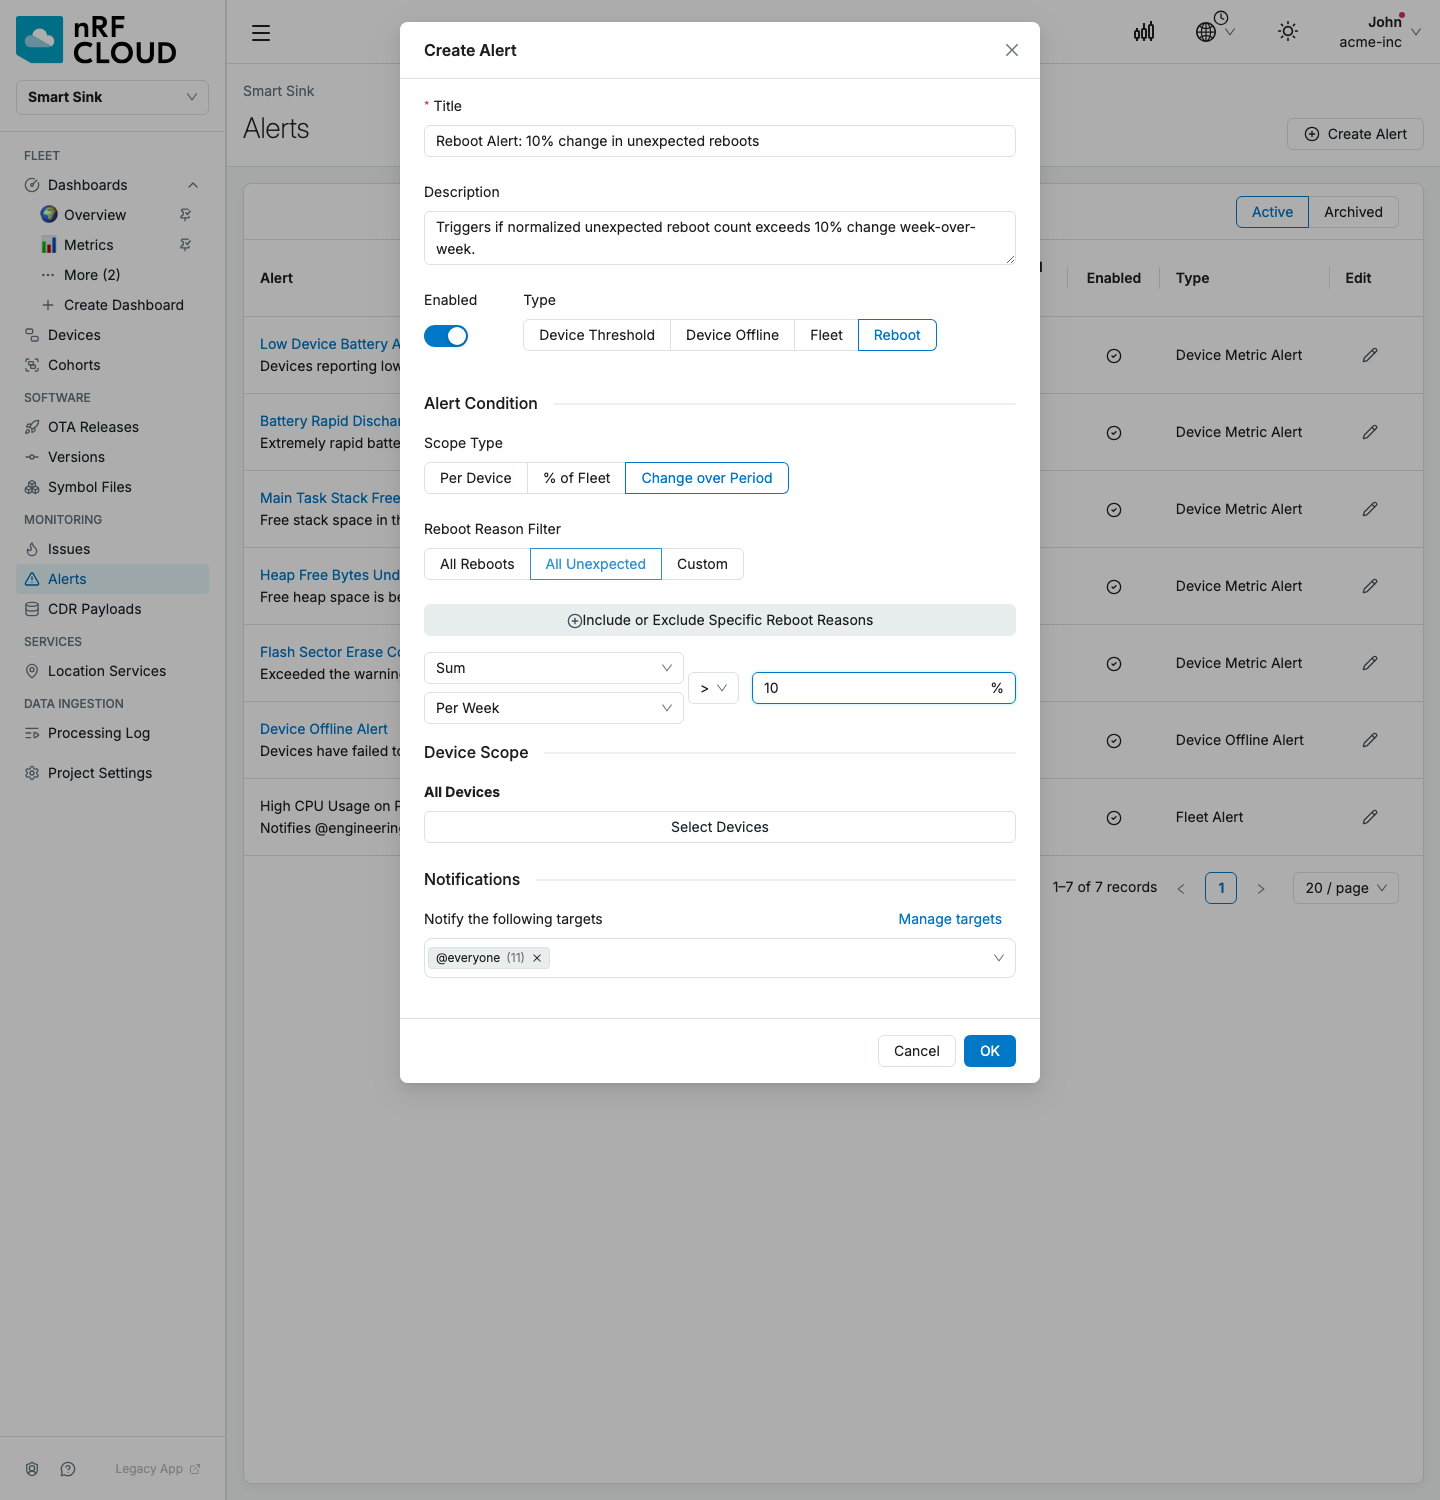
A reboot alert that triggers when the summed unexpected reboot count increases by more than 10% week over week.
Saved search alerts
Saved search alerts notify you when the results of a Saved Device Search or Saved Issue Search change. For example, save a search for devices on the latest release that have had a watchdog reboot, and get notified each time a new device matches it.
Each alert has one of three triggers. The dialog says "device" or "issue" depending on the saved search.
- A device enters the search results: a device starts matching the search.
- A device leaves the search results: a device stops matching the search.
- The number of matching devices exceeds a threshold: the number of matches goes from below the threshold to at or above it.
A saved search can have more than one alert, such as one for devices entering and one for devices leaving. Each alert must be different, so two threshold alerts on the same search need different thresholds.
Creating a saved search alert
- Open a saved search on the Devices or Issues page and select Create Alert. You can also find Create Alert in the More Actions menu on the All Saved Searches page.
- Under Trigger, choose when the alert fires. For a threshold, enter the number of devices or issues.
- Under Alert the following targets, select at least one notification target. Your project's default targets are filled in for you.
- Select Create Alert.
Managing saved search alerts
Saved search alerts are listed under Alerts, on the Saved search alerts tab. To see the alerts for one saved search, filter by it, or select the count in the Alerts column on the All Saved Searches page.
To edit or delete an alert, use the ⋮ menu in its row. To pause an alert without deleting it, edit it and turn off Enabled.
Deleting a saved search also deletes its alerts.
Evaluation
Every hour, nRF Cloud runs each saved search that has an alert and compares the results with the previous run.
- A new alert can't fire on its first run, since there's nothing to compare against yet.
- After you edit a saved search's filters, enter and leave alerts wait until two runs have used the new filters. Otherwise the edit itself would show up as devices or issues entering and leaving.
- If the previous run is more than three hours old, the comparison is skipped and the next run compares against the current results.
- Threshold alerts fire once when the count crosses the threshold. They fire again only after the count drops below the threshold and crosses it again.
Saved search alerts don't create incidents. When one fires, the notification shows how many devices or issues entered, left, or match the search, with up to five examples. Enter and leave notifications also link to the exact devices or issues that changed.
Device alert incident details
After you configure a device alert, nRF Cloud watches for events matching the criteria specified and creates incidents. Incidents appear in the UI almost immediately. To review them, go to Alerts and select the alert. Incidents are listed per device.
Only device alerts have incidents. Fleet threshold alerts do not.
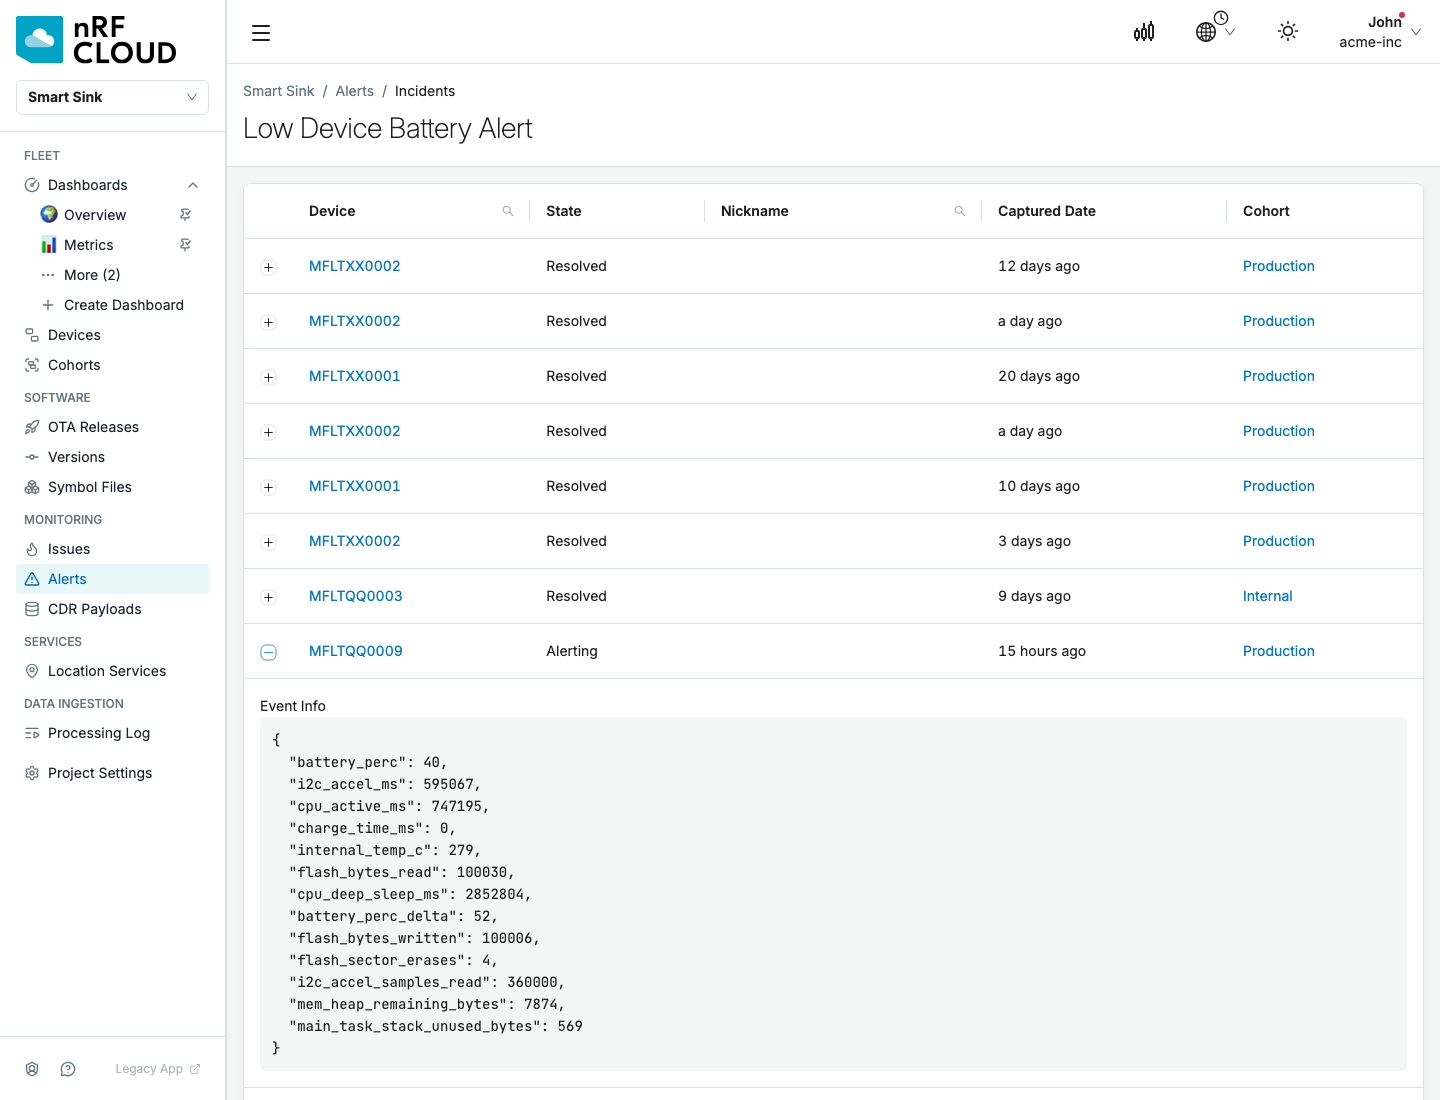
Incidents listed per device. Expanding an incident shows the metric payload that triggered it.